Wednesday, April 27, 2011

GDP Growth and Revision Lecture

This morning, it's been announced that GDP growth in 2011Q1 was 0.5%, which essentially matches the contraction of 2010Q4, and is, according to Duncan Weldon, a borderline terrible growth figure.

On another note, next Tuesday is the econ101b revision lecture. Come along with questions, we have two hours to play with. It's 3-5pm in Mech Eng G31.

Monday, April 11, 2011

The Vickers Report - Interim

The Independent Commission on Banking, being headed up by Sir John Vickers, is delivering its interim report today. The commission is due to report back in full by September, but as is the way, in the meantime it's giving us some titbits to go on. You can see some comment here from FT Alphaville - they'll be commenting more later.

If you are interested in the Financial Crisis and its aftermath, and interested in what will happen to the banks (who isn't?), and want to be somewhat informed, then having a read of all this will help you. It will certainly help you as you revise and think about what we talked about in week 7 on Money and Interest Rates, and also as you think about money markets more generally (feeding into the LM curve in the IS-LM model).

Highly recommended stuff...

Friday, April 8, 2011

A Little Bit of Looking at the Data

Today the Daily Mail is again talking about how the UK was on the edge of an economic apocalypse before George Osborne saved the day! Some things never change.

What would be more interesting would be to actually look at the economic data beneath the political and journalistic hyperbole, wouldn't it?

I'm writing up some long overdue notes for some lectures I did on fiscal policy, and I figured I'd just have a little look at the government deficit in the context of real GDP growth in the UK over the past 30 years. Here's what the two data series look like:

The government deficit to GDP ratio, and real GDP growth

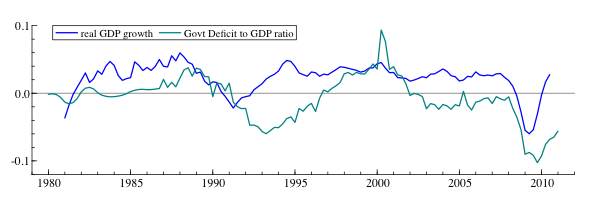
Why am I doing this? Well because when an economy enters a recession, things economists call automatic stabilisers kick in: Benefits are paid to people made unemployed, and income and corporation tax receipts fall since less profits are made and less income is earned. These two effects will make a budget deficit worse regardless of how profligate a government is, so long as it provides unemployment benefits, and runs an income and corporation tax system.

So what about the biggest recession in 70 years kicking in? Surely that's going to have quite an impact on government finances, right? Looking at the two series above, we can see that indeed the recession we just emerged from was deeper than anything since 1980, and indeed the government deficit was also deeper. It's interesting to note the 1992 recession, post-ERM. After that, there is quite a large budget deficit for quite a while. Interestingly enough, that deficit only becomes a surplus after 1997.

However, we should really think about taking the data seriously, shouldn't we? Eyeballing only gets one so far. Now both series are probably stationary (econometric speak), but clearly show persistence - GDP growth is strong for a while, then weak, deficits tend to hang around like bad stains. So we should think about a dynamic econometric model. The real beauty of such models (say, an Autoregressive Distributed Lag model) is that we can let the data tell us about the long run solution, or error correction reformulation as it's called in the linked paper. This is the long-run relationship between the two variables: So if real GDP growth is at its expected value, what do we expect the deficit to be?

This way we can say: How far out of equilibrium are we right now, compared to economic history? I'm not going to bore anyone with the details (email me if you'd like them, I'm more than delighted to provide), but of course it's fascinating to look at something like this and see just how much we are currently teetering on the brink. The red line in the following diagram shows us exactly how far out of equilibrium we are currently:

Fiscal Equilibrium in the UK

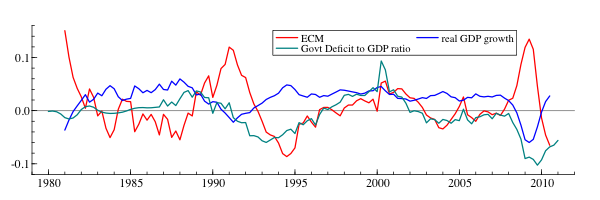
The deficit and real GDP growth are also plotted there still. The red line is equilibrium, or how much too high or too low is the deficit given the state of the economy. The important thing is that this is estimated over real data, and it should also be said that this is data starting in 1981, so 16 years of a Conservative government then followed by 13 years of Labour - it's a nice mix of the two.

So we see the impact of the financial crisis with a big positive movement which looks bad, right? That is until you realise that this is saying that the deficit was not large enough given the size of the contraction in real GDP! Calculations, based on the data, says that at the height of the recession, when real GDP contracted at 6%, the correct deficit given past UK economic history (16 years of Conservatives), excluding all economic theories, the deficit should have been an eye-watering 22% of GDP, not the trifling 9% it was at this point (2009Q2). Only as we entered 2010 did the equilibrium relationship (called ECM) turn negative, suggesting the deficit is too high now, and even by 2010Q3 it had not reached the depths of disequilibrium (a deficit too high) it reached in 1994.

Interesting stuff. Are we teetering on the brink of an economic apocalypse? Were Labour reckless with public finances? Not if you consider economic data taking into account Conservative policies between 1981 and 1997, at any rate.

Tuesday, April 5, 2011

The Alternative Letter

We've recently covered monetary policy, and the current UK framework where the Bank of England has been granted independence from political interference to use tools of monetary policy (interest rates and QE amongst others) to achieve an inflation target. We noted in lectures that for a long time now, the Bank has missed the target and we have inflation over 4% (target 2%).

In Money Week there's a mock alternative response from the Chancellor; if inflation misses the target, the governor of the Bank writes a letter to the Chancellor, and the next day the Chancellor responds. The Chancellor usually refrains from being critical, and hence this has drawn criticism: Why shouldn't the Chancellor start holding the Governor to account?

The letter is of course highly sarcastic and tongue in cheek, but it is written for a reason and helps us think a little more about monetary policy and the current framework. It is essentially true that the Bank has no regulator: Nobody is really keeping check on whether the Bank hits the target or not. Osborne can't really do it, as the letter kind of hints at with its final riposte: Maybe we should find someone else to do the job if you can't Mervyn (paraphrasing). If Osborne wrote a letter like this, it would be a very clear indication that the Bank's independence was no longer. If the Bank did subsequently raise rates, regardless of why it did so, it would be easily interpreted as having done so under political pressure. And if political pressure starts once again to dictate what happens with interest rates, then we're right back to square one, where we were before 1997 and the political business cycle.

The letter also makes some other important points:

  • Why are forecasts so bad?
  • How do we know inflation is caused by the weak exchange rate and not negative real interest rates and QE?

On the first, the stock answer is that the economy is a complicated beast. But the letter kind of hints at that when it criticises the reliance on the output gap in a rather Austrian-type criticism: How can we really know about this incredibly complicated and generally theoretical entity called the macroeconomy? Of course, just because something is complicated is no reason to give up on it, particularly when policy needs to be made (I'm not going into any arguments over free banking and the like).

On the second, the 30% fall in the trade-weighted exchange rate noted in lectures means that the goods we import (which is quite a few) are more expensive, and since these often take up a large portion of our basket, then it is quite reasonable to assert the high inflation is due to that - along with the VAT rise, since that also makes the goods we buy more expensive. Remember, inflation is just the change in the Consumer Price Index (CPI), year-on-year, for a given month, and the CPI is calculated over a "basket of goods" which is supposed to be representative of what the average person buys.